LogPoint provides a number of options for search result visualization. While visualizing the search results or the content of a widget, it is possible to dive deeper into the results by clicking the graphical representation. For example, while viewing a search result which includes the fields such as destination_address, destination_port, source_address, and source_port in the search query, it is possible to drill down to the results based on these parameters. Use the keys from the original query to drill down.
Depending on the original query chosen to drill down from, the contents in the drill-down context menu varies. There are 3 types of drill-down options in LogPoint visualization:
Filter
Drilldown by
Top 10 drilldown by
The Filter type drill-down searches on the Range, the Field, and the count(). The Drilldown by and the Top 10 drilldown by types drill down on the fields and the labels respectively.
For example:
destination_address=* source_port=* destination_port=* source_address=*
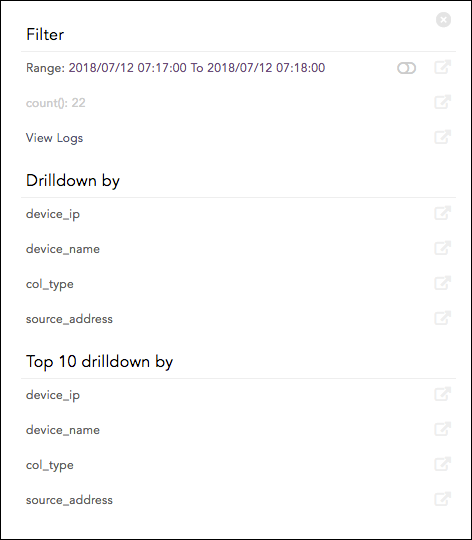
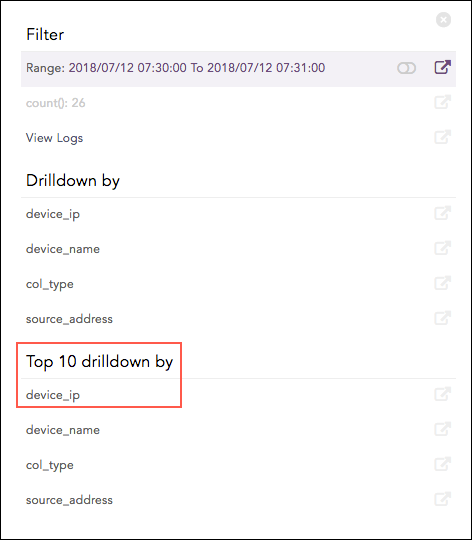
While performing drill-down from this query, the following context menu appears on the screen. It lists all three possible sections in a drill-down context menu.
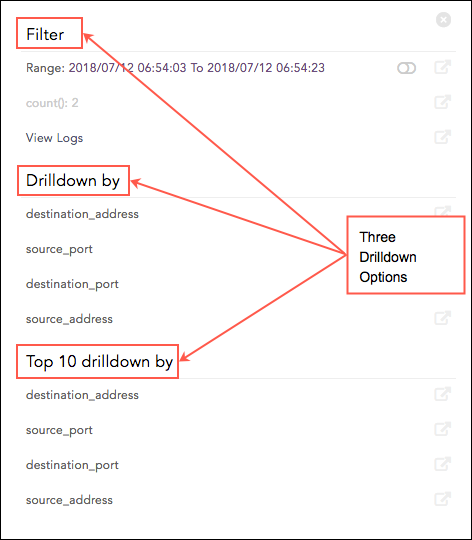
Context Menu - Three Drilldown Options
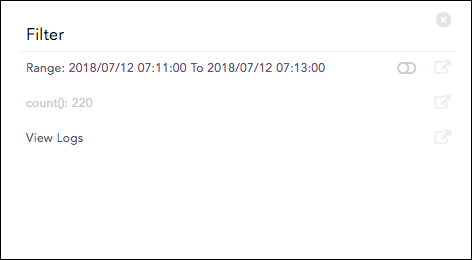
Filter
This section contains the following components depending on the original query:
Range: Displays the subset of the time-period from which you have chosen to drill-down. It is only displayed for queries containing the timechart command or logs plotted in a time series manner.
count(): Total number of logs.
View Logs: Lets you view the drilled-down logs. You can view them in the same or a new window by clicking View Logs in the context menu for the given time-range.
Note
By default, the Drilldown on full result set slider and count() are disabled (grayed out).
Drilldown by
This section contains the fields or labels present in the original query.
Top 10 Drilldown by
This section contains the fields or labels present in the original query.
Besides these, the context menu also contains some other options for the following.
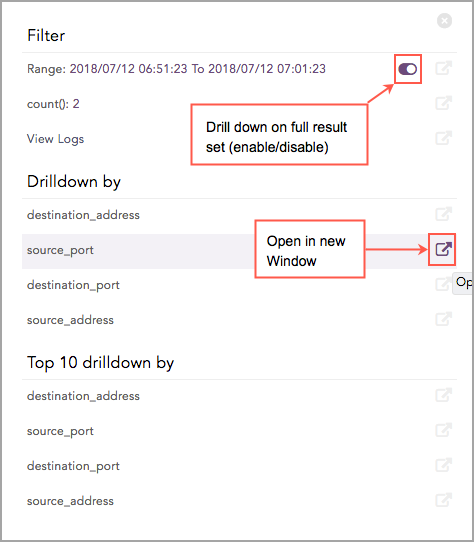
Drilldown Context Menu
Drilldown on Full Result Set
It is possible to drill down on the full result. The slider icon present next to the Range value lets you drill down on the full result set in addition to the subset.
Open drilldown in a New Window
While performing drill-down, it executes in the same window by default. However, you can click the Open in New Window icon to open the results in the new window.
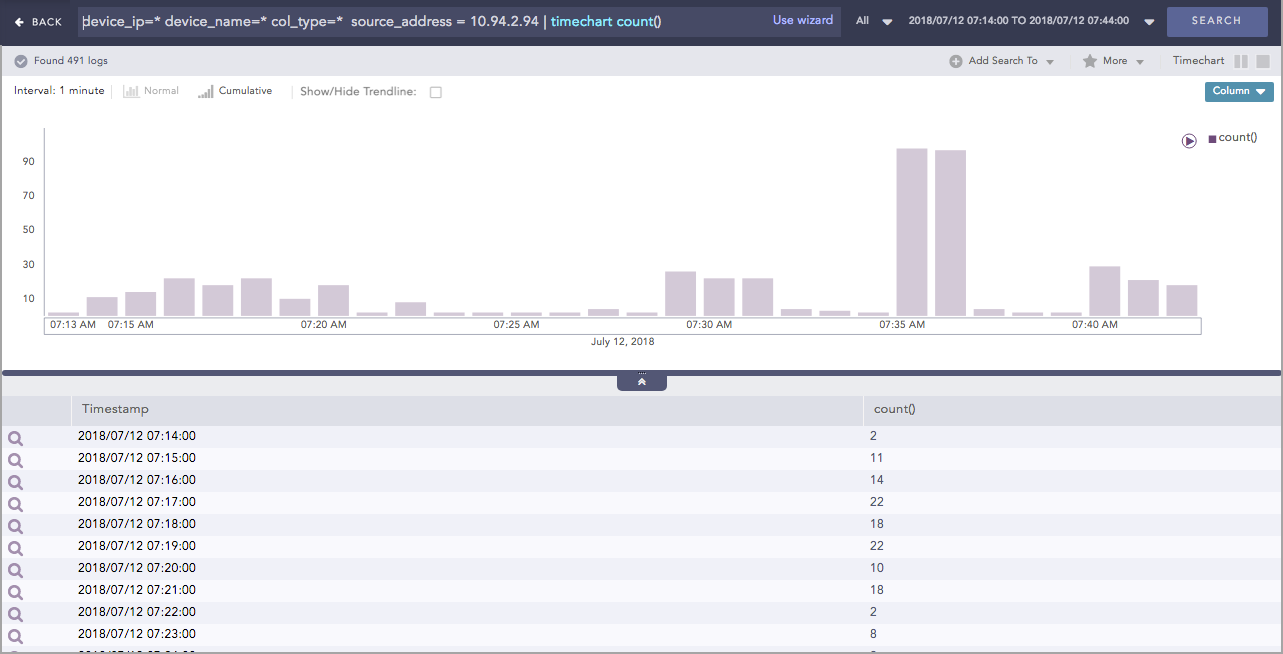
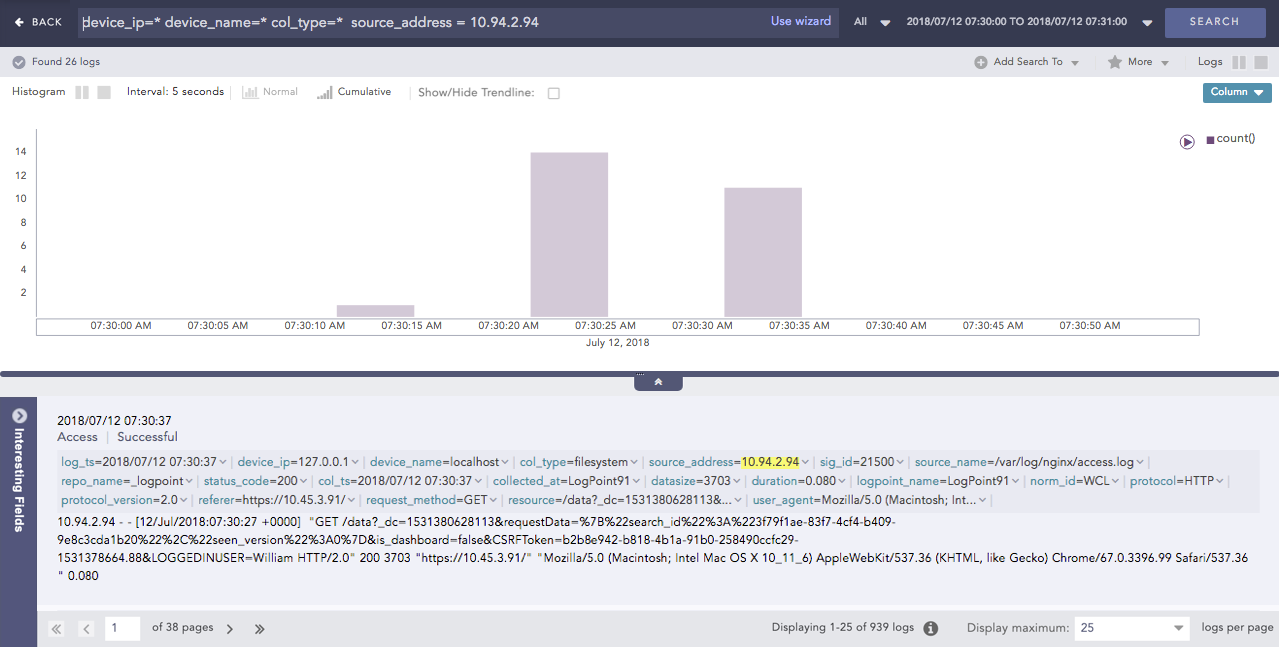
Consider the following search query:
device_ip=* device_name=* col_type=* source_address = 10.94.2.94
This query displays the following visualization.
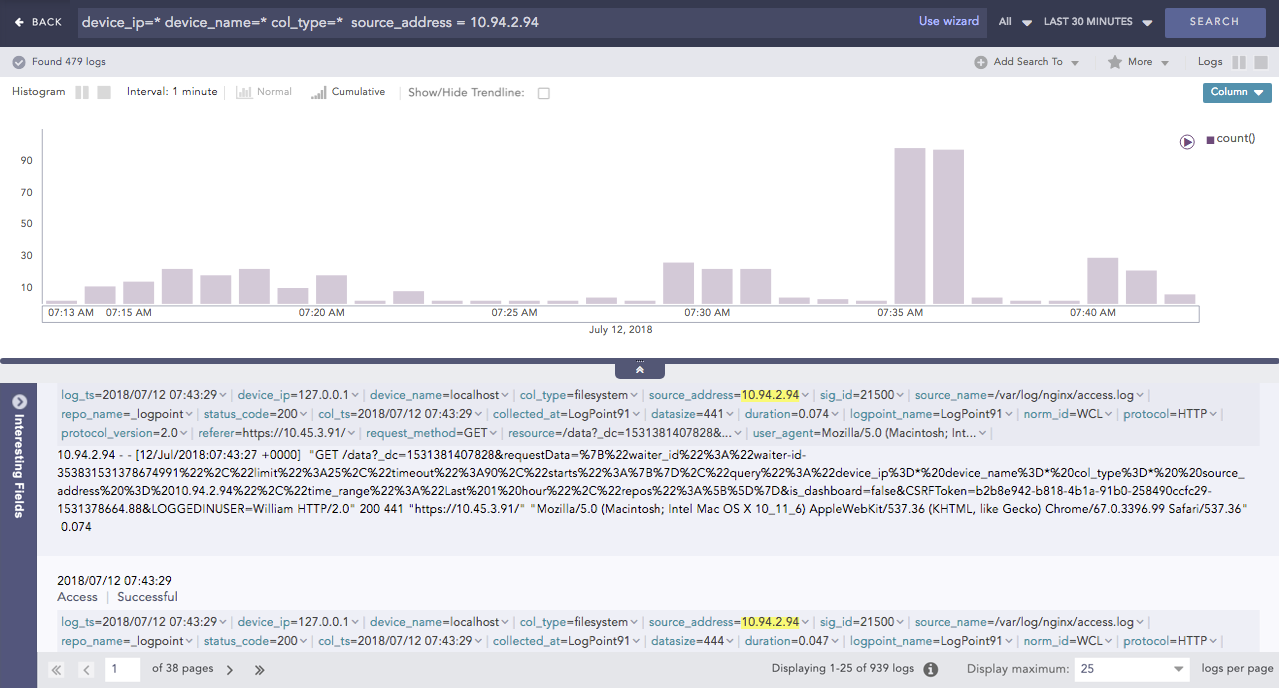
Search result visualization
LogPoint’s search result drill-down actions let you dive deeper into the details of the information presented in the visualization. If you hover over the search graph, the related information of the selected area is summarized in a tooltip.
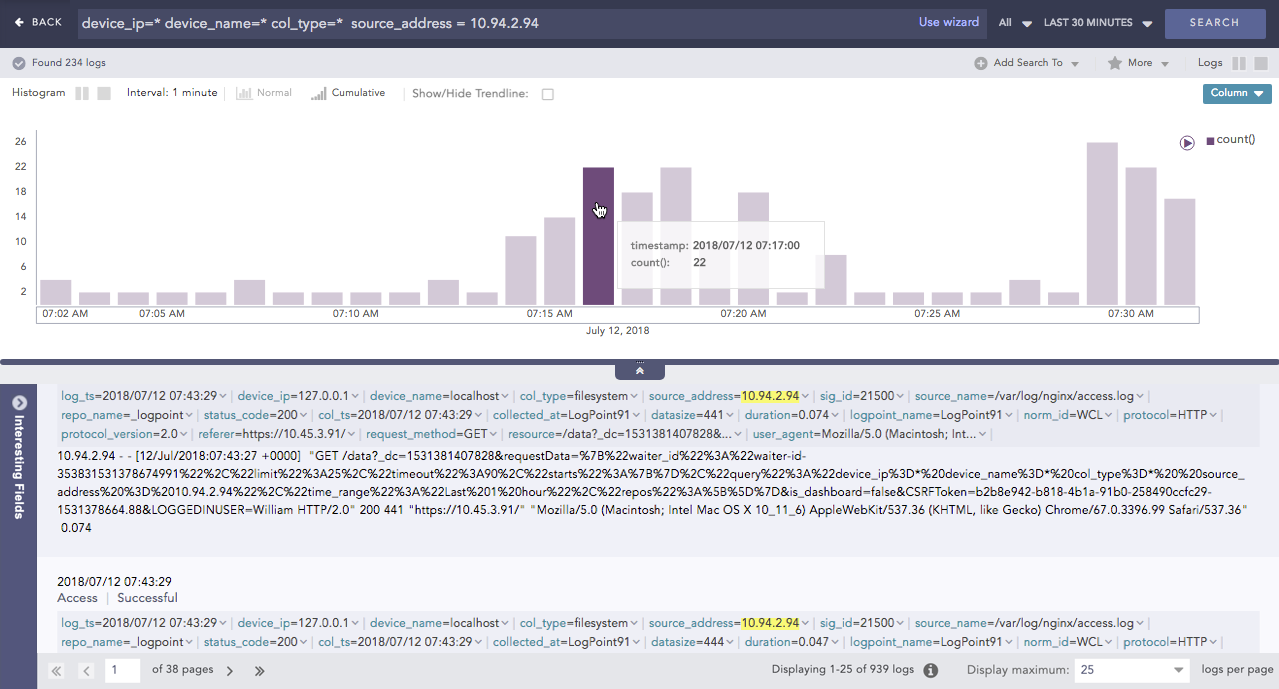
Mouse hover in search result visualization
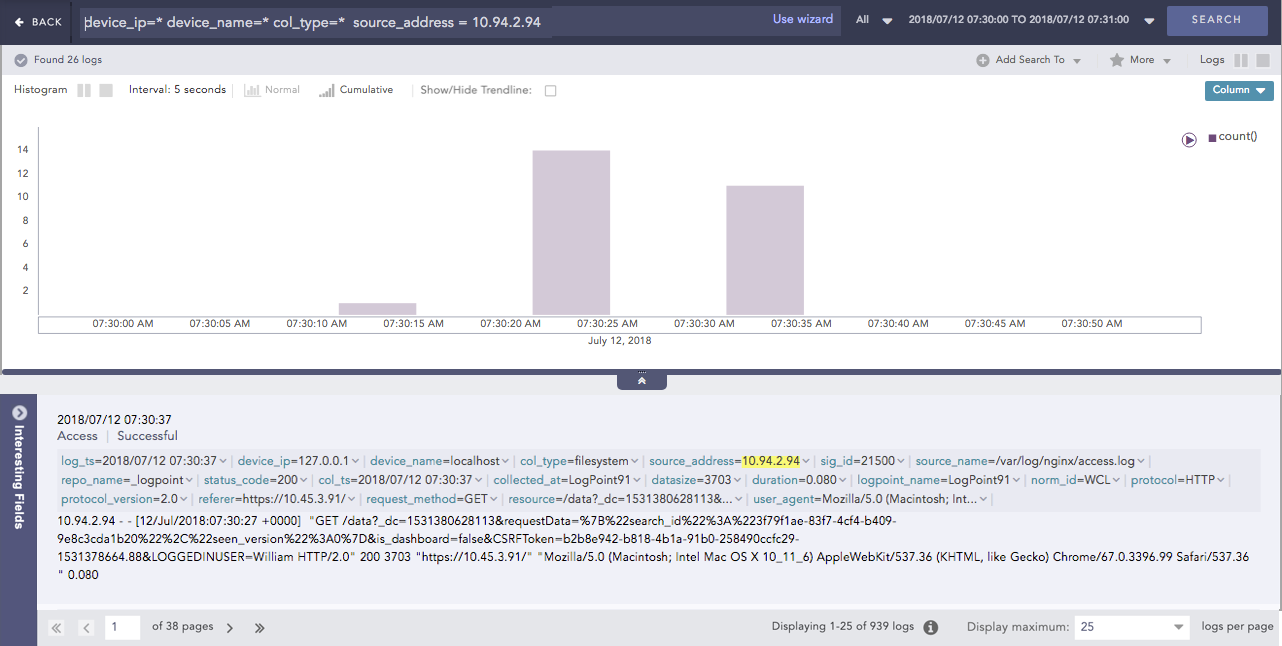
Click the highlighted section of the result.
Drilldown context menu
In the context menu, enable or disable the drill-down on the Range value by clicking the slider icon. The corresponding search visualization for the Range is shown below:
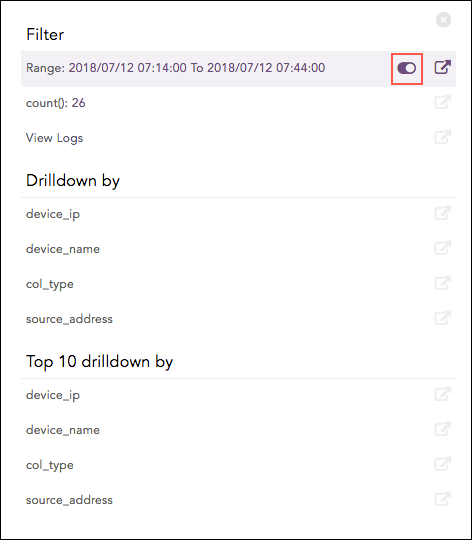
Enabling Range
Search Visualization after Enabling Range
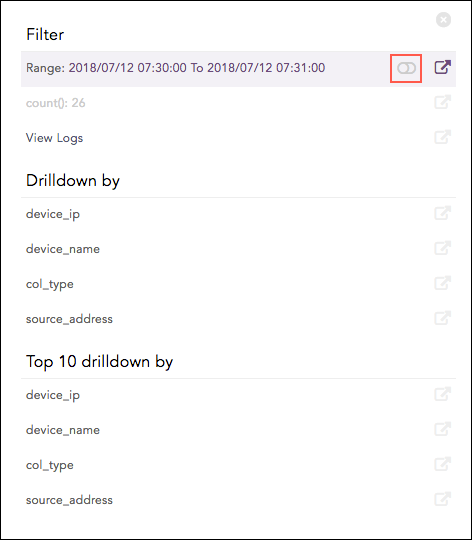
Disabling Range
Search Visualization after Disabling Range
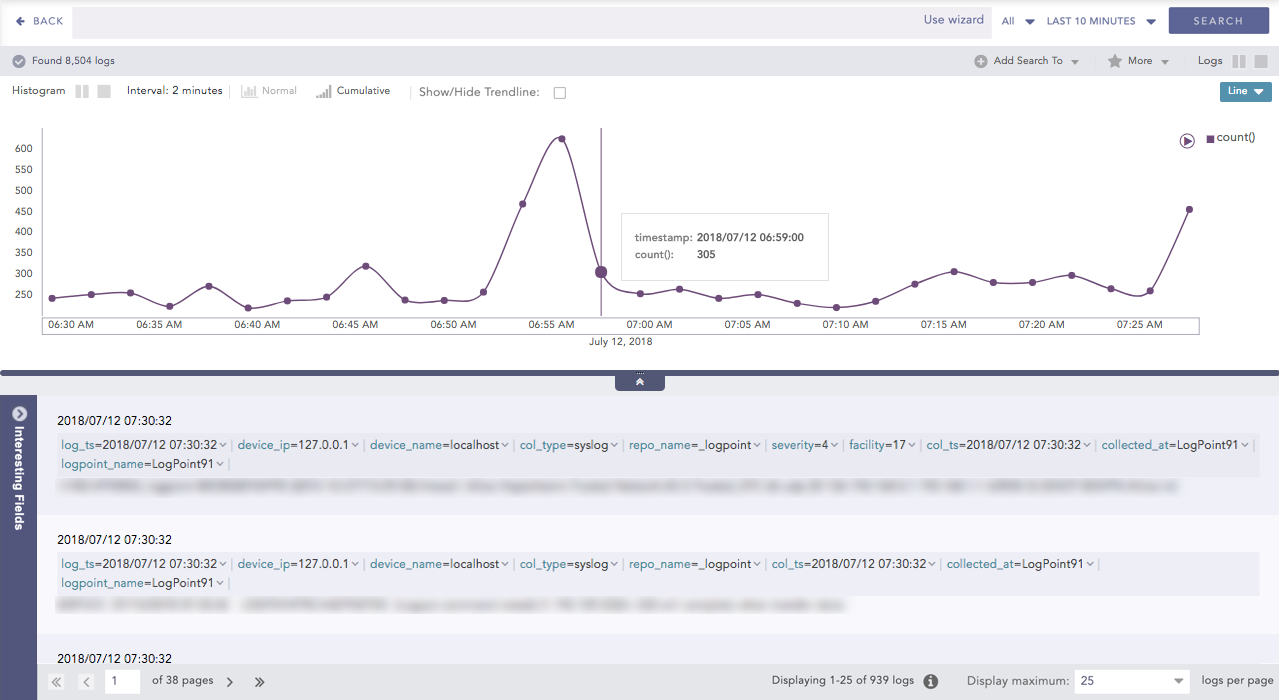
Click View Logs to see the corresponding log results. The results can be viewed in the same window or in a new one.
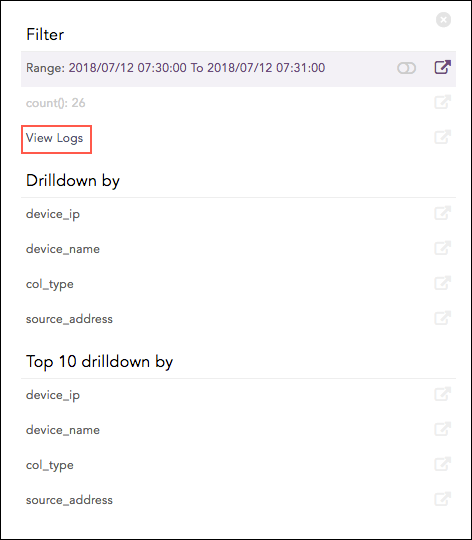
Search Visualization for “View Logs”
Click the required Field-values in the Drilldown by section to see the corresponding search results. The results can be viewed in the same window or in a new one.
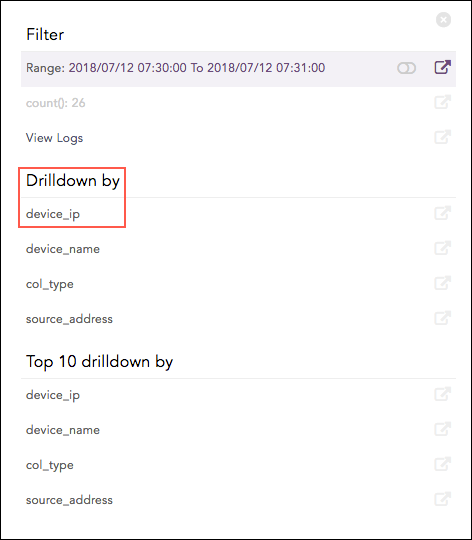
Search Visualization for “Drilldown by”
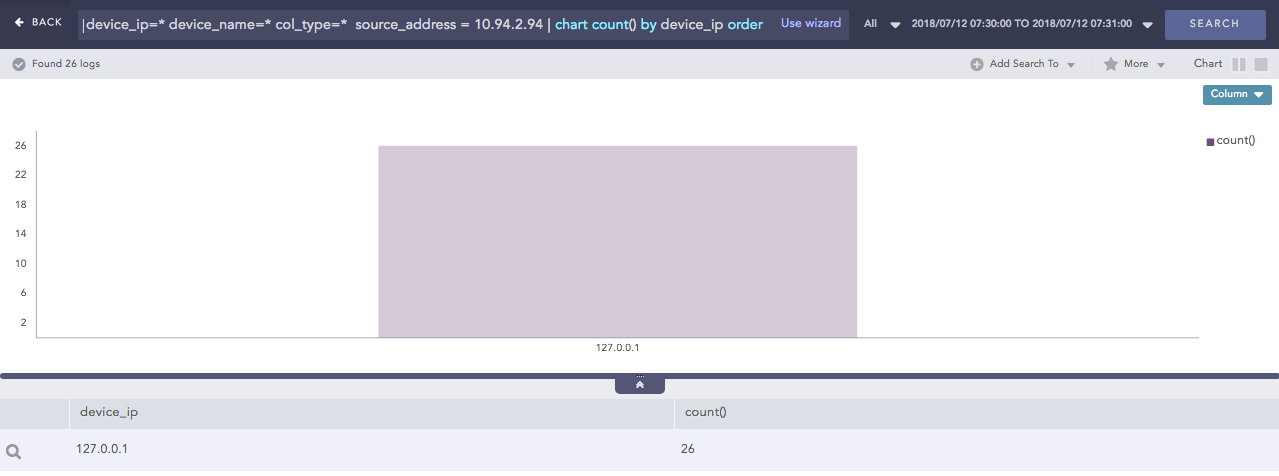
Click the device_ip in the Drilldown by section to append chart count() by device_ip order by count() desc in the search query. The search result can be viewed in the same window or in a new one.
device_ip=* device_name=* col_type=*  source_address = 10.94.2.94 | chart count() by device_
ip order by count() desc
Click the required labels in the Top 10 drilldown by section to see the corresponding search results. These results can be viewed in the same window or in a new one.
Search Visualization for “Top 10 Drilldown by”
Search Visualization for “Top 10 Drilldown by”
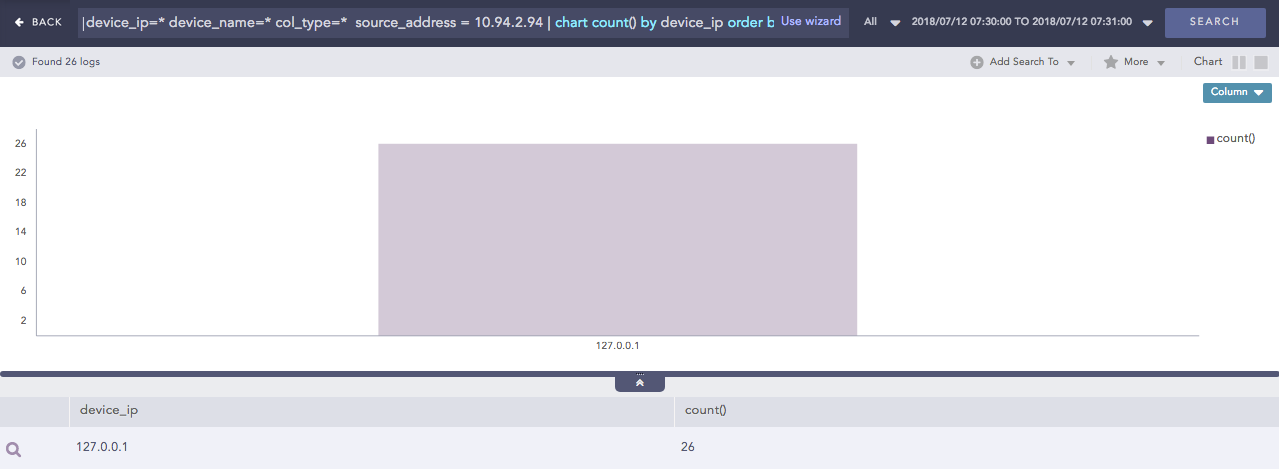
Click device_ip in the Top 10 Drilldown by section to append | chart count() by device_ip order by count() limit 10 desc to the search query. Choosing device_ip results in the following query.
device_ip=* device_name=* col_type=*  source_address = 10.94.2.94 | chart count() by device_
ip order by count() desc limit 10
Similarly, the search results can be drilled down on the basis of the source_port, destination_port, and the source_address.
The search result can be further drilled down by clicking any part of the result set.
device_ip=127.0.0.1 device_name=* col_type=*  source_address = 10.94.2.94 | chart count() by device_
name order by count() desc
Example 1
For Filter Drilldown, if you drill down on the Range and open the results in the same page, the search is executed in the selected time-range. If you open the search in a new window, it is executed in the selected time-range with | timechart count() appended to it. The command is appended only for simple queries.
Empty search result
Select a bar to drill down from. The following context menu appears.
Context Menu
Once you drill down, you can see results similar to the following example.
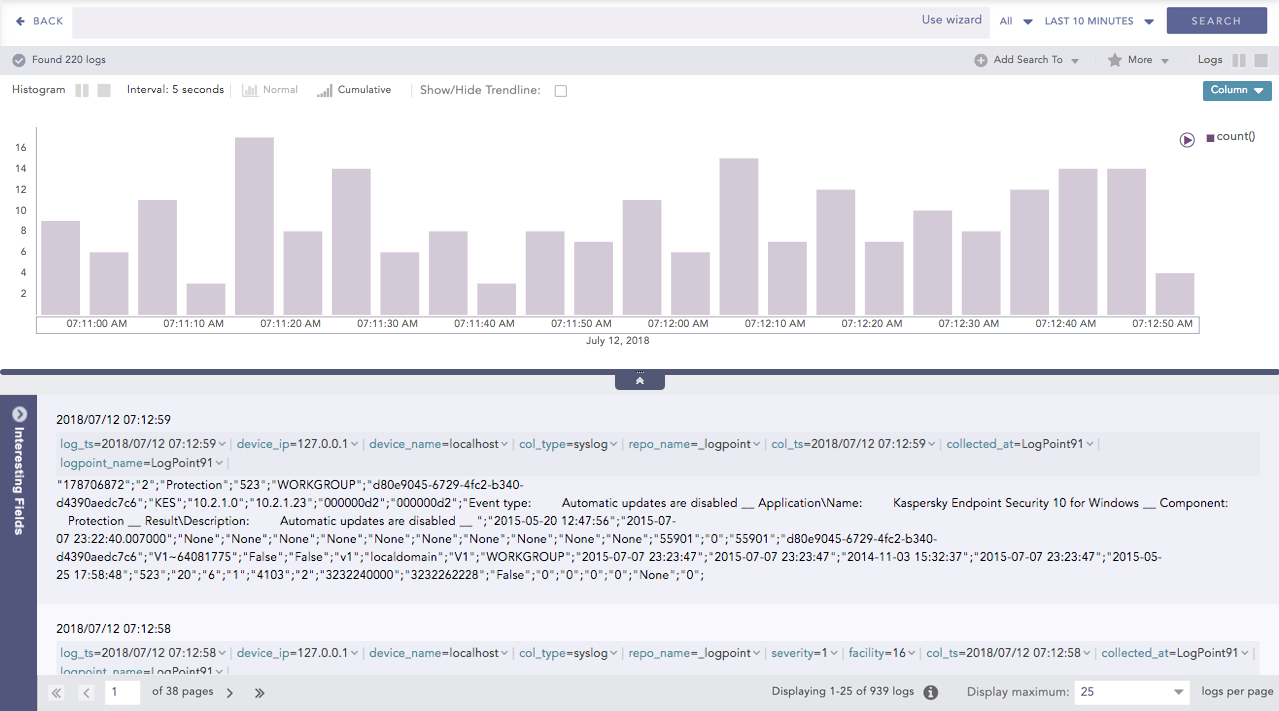
Results
For the filter type, when the drill-down is executed on Field, search is executed with | filter <field> = <value>
Consider the following query:
action=*|chart count() by action
The following visualization appears.
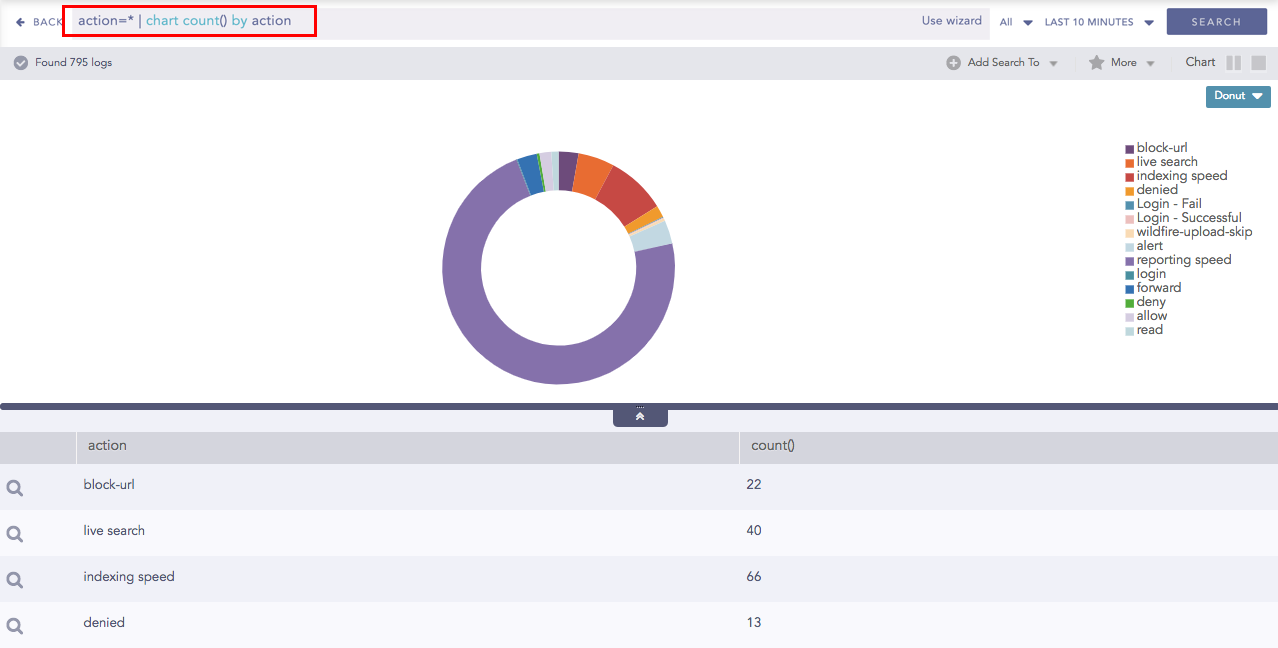
Drilldown on filter type (Field)
If you drill down on the reporting_Speed, the following context menu appears.
Drilldown context menu for filter type (action = reporting speed)
If you drill down on the reporting_speed, the appended search query is:
action=* | chart count() by action | filter "action"="reporting speed"
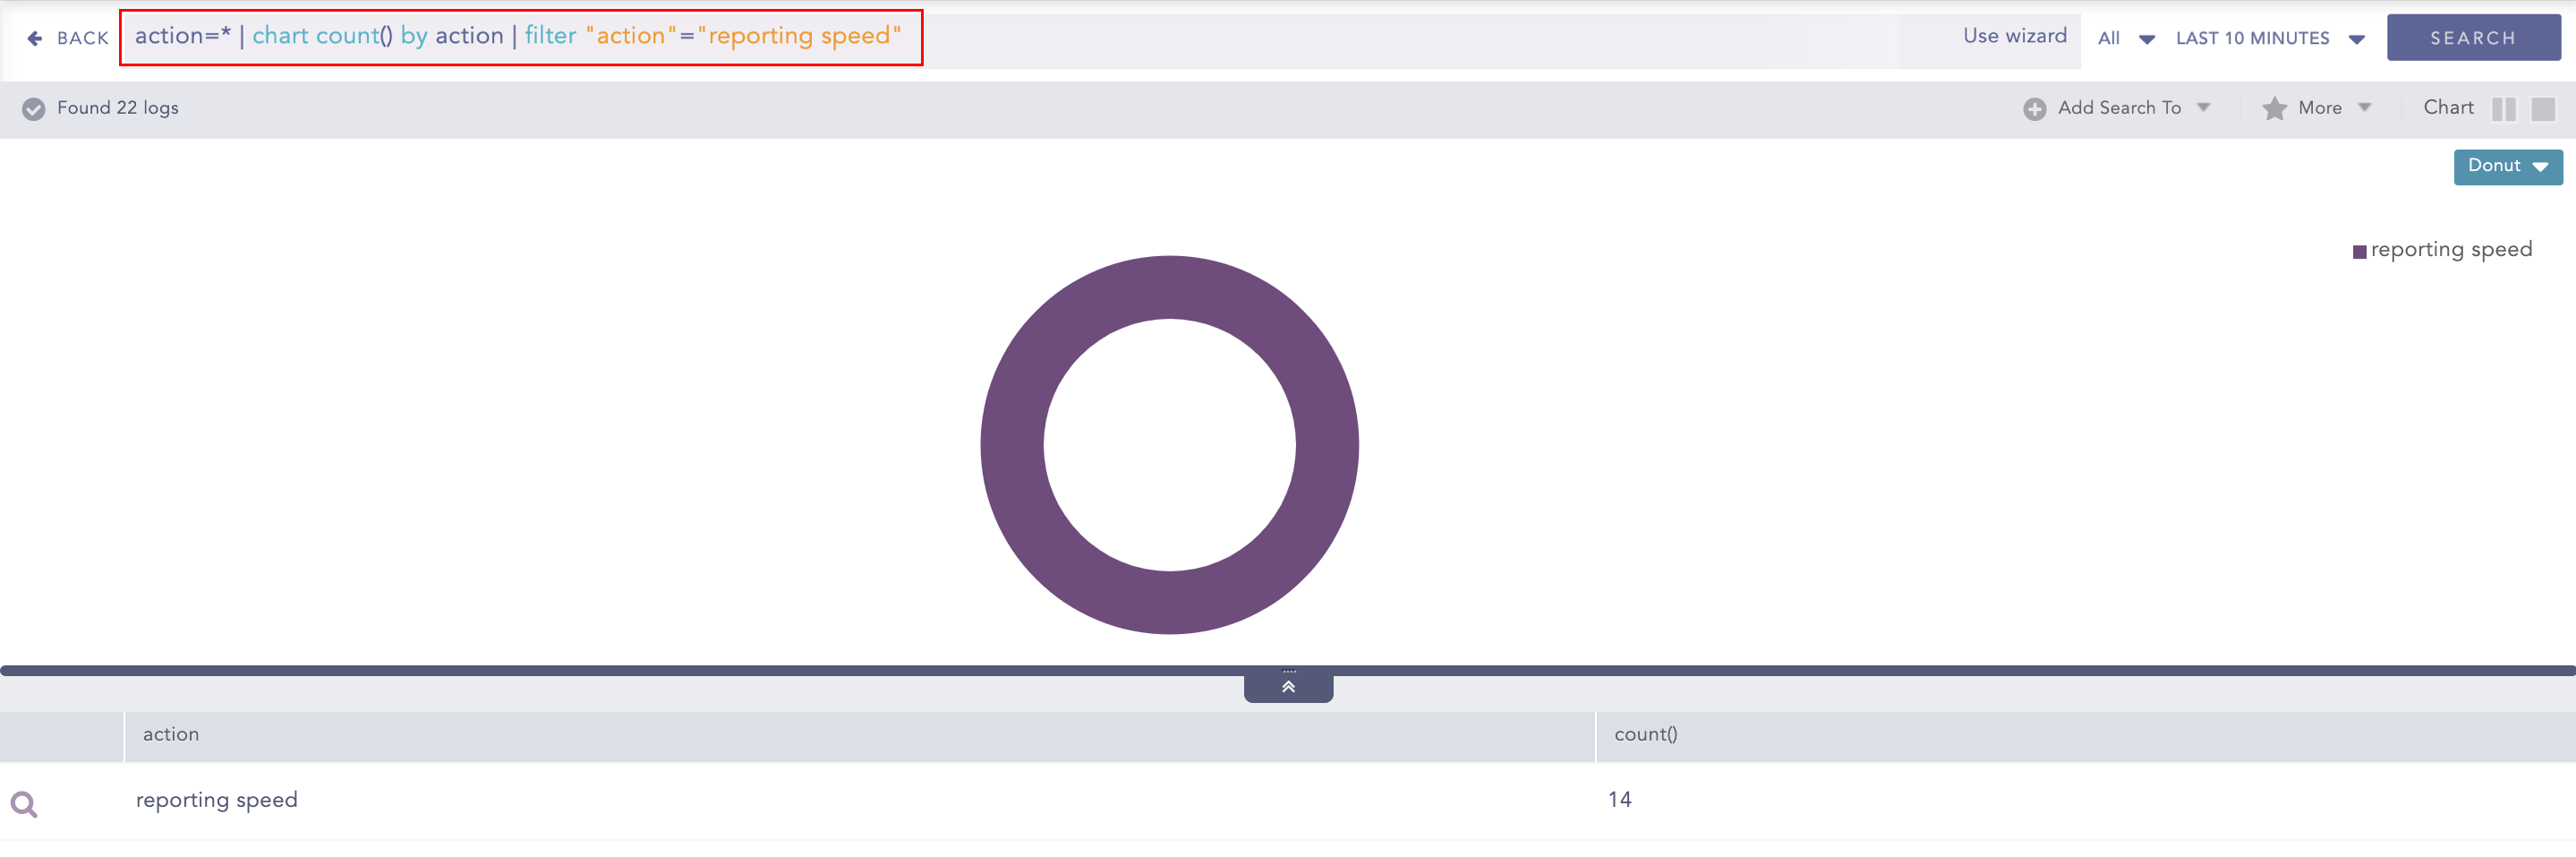
Appended Search Query for Drilldown on filter type (action = reporting speed)
Example 2
When the drill-down is executed on count() for the Filter type, the search is executed with | search count() = <value>. Consider the following example:
action=* | chart count() by action
The following visualization appears.
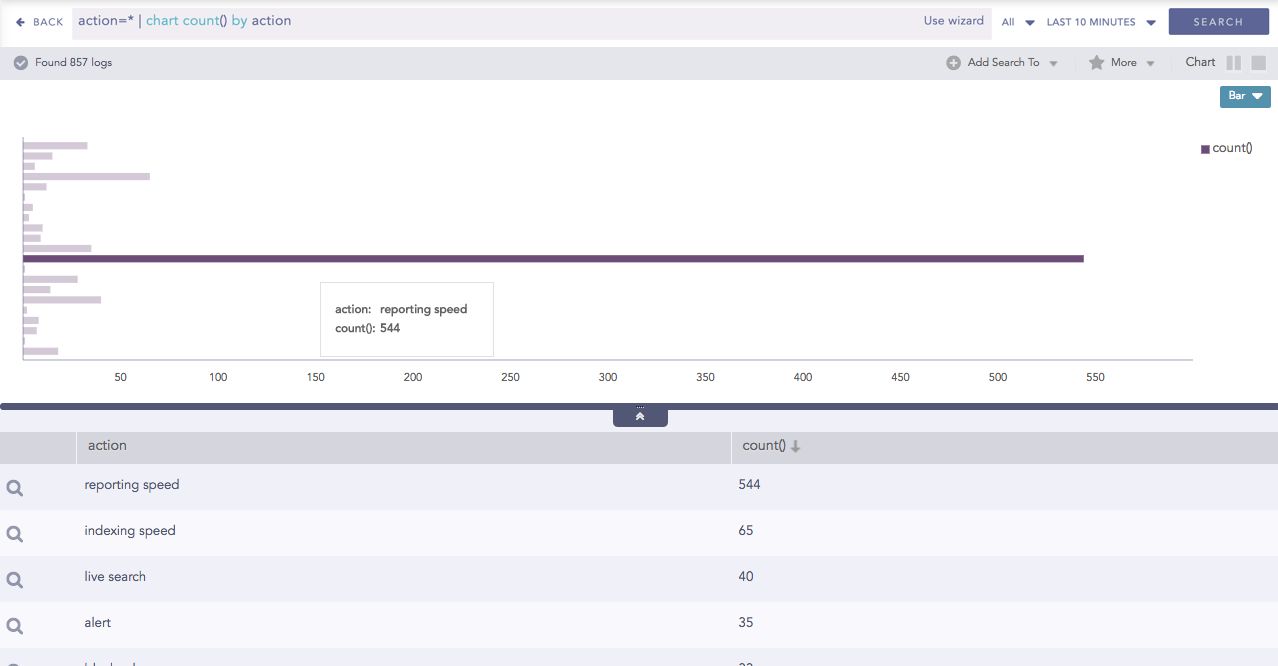
Drilldown on filter type (Count)
The context menu for this drilldown is:
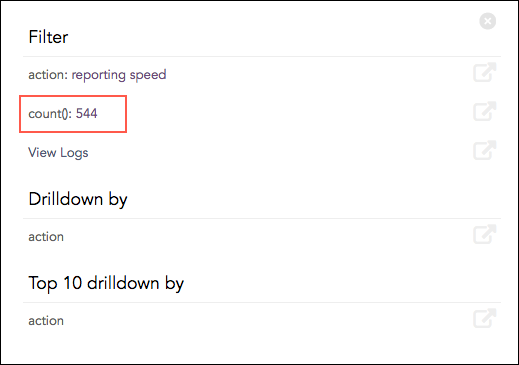
Drilldown on filter type (action = reporting speed)
When the drill-down is executed on count(): 544, the new appended query is:
action=*|chart count() by action | filter "count()" = 544
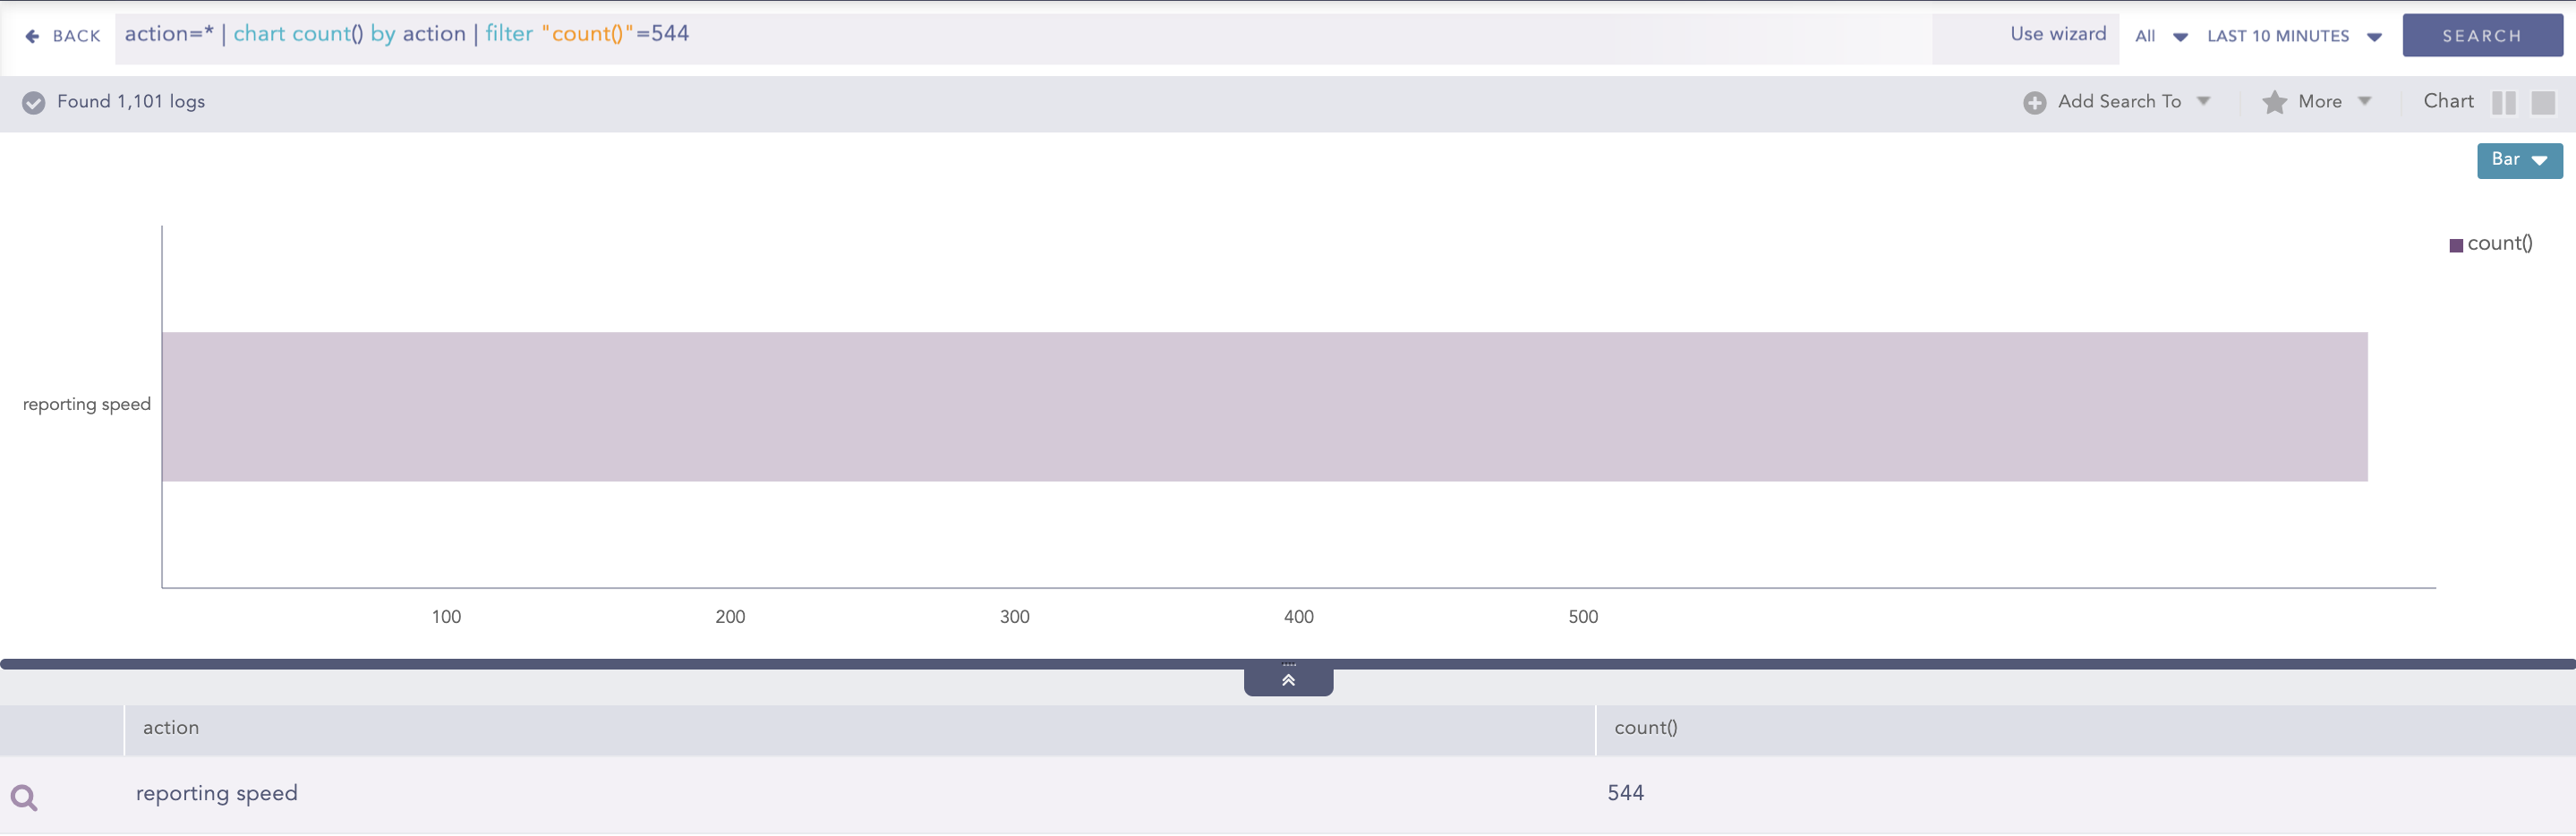
Drill-down on count(): 544 for filter type (action = reporting speed)
Example 3
When the drill-down is conducted for <empty_query> | chart count() by group, the customizable drill-down options differ. Consider the following:
| chart count() by action
The following visualization appears.
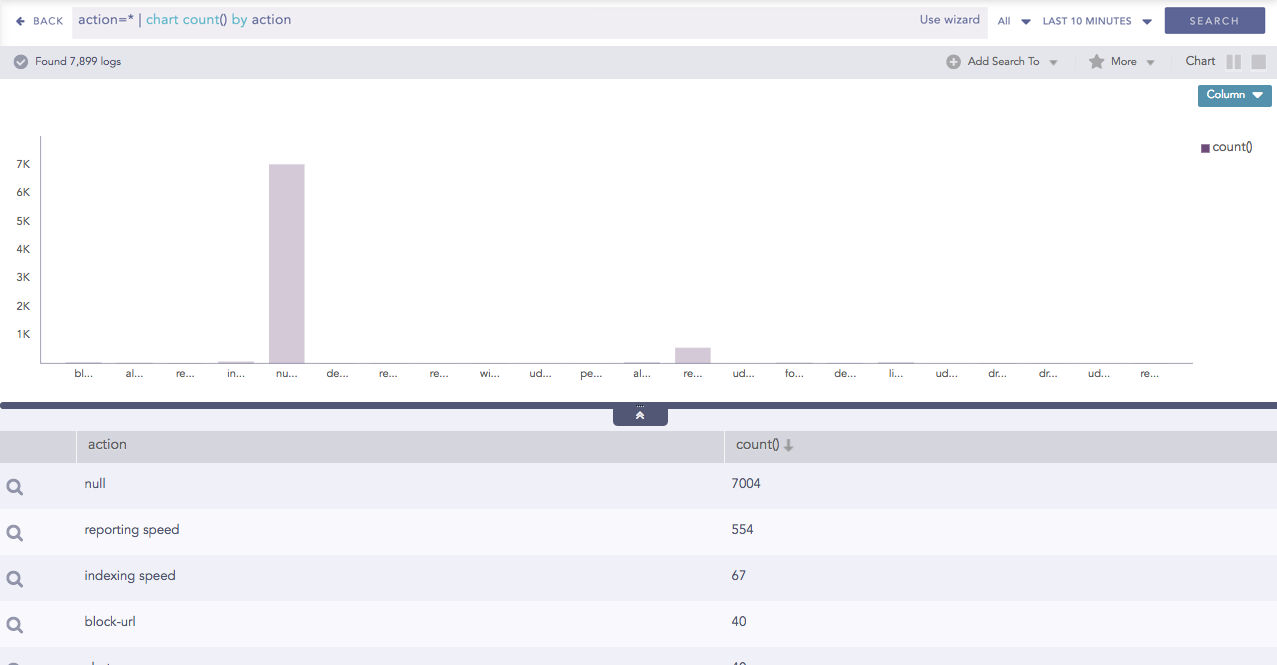
Search result for chart count() by action
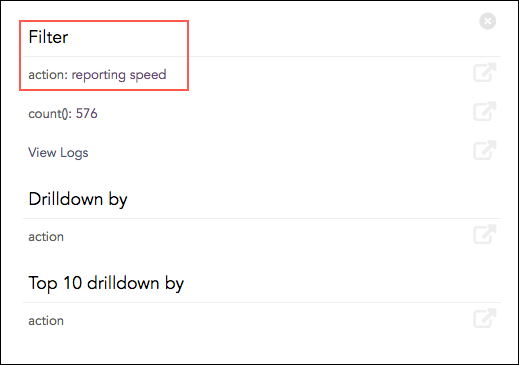
Clicking drill-down for a bar opens up the following context menu. In this case, only the Filter section with field, count() and View Logs is displayed as shown.
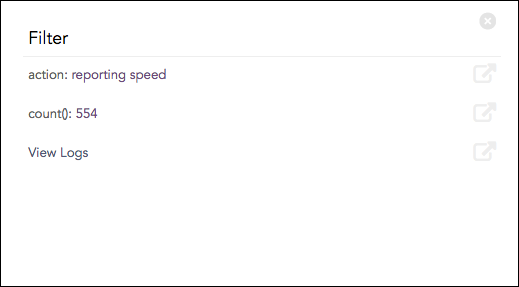
Drilldown by for chart
If you click “action: reporting speed”, the new query becomes:
| chart count() by action | filter "action"="reporting speed"
If you click “count(): 544”, the new query becomes:
| chart count() by action | filter "count()"=544
For Drilldown by, when the drill-down is executed on fields or label, search is executed with the given query followed by | chart count() by <field> order by count() desc
For example:
action = denied
The following visualization appears. Hover over the required result and click to drill down.
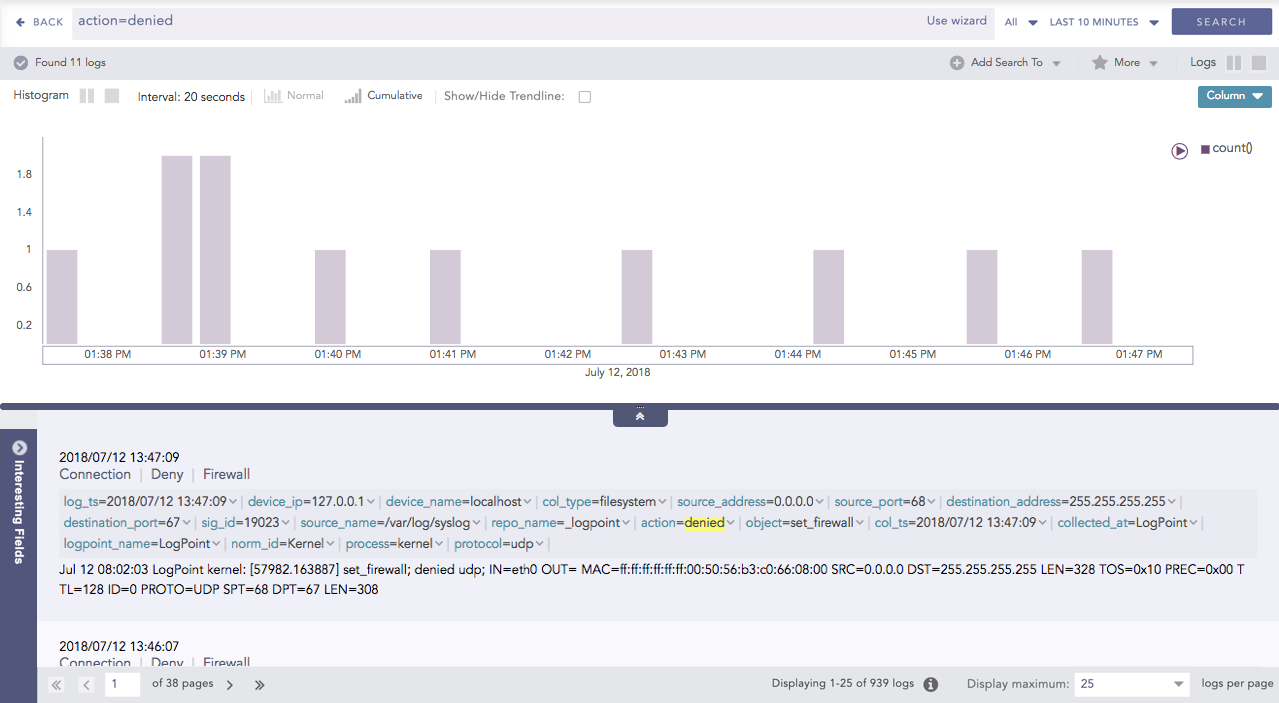
Search result for action = denied
In the Drilldown Context Menu, click action under the Drilldown by section.
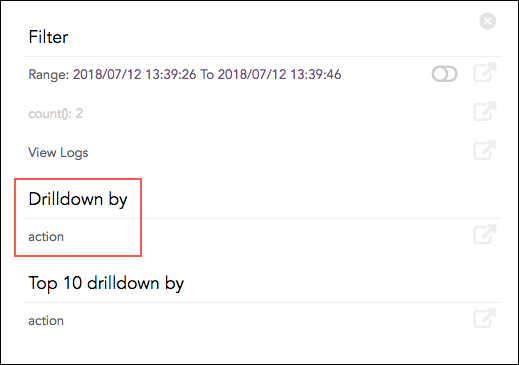
Drilldown context menu
The search results of the drilldown appear.
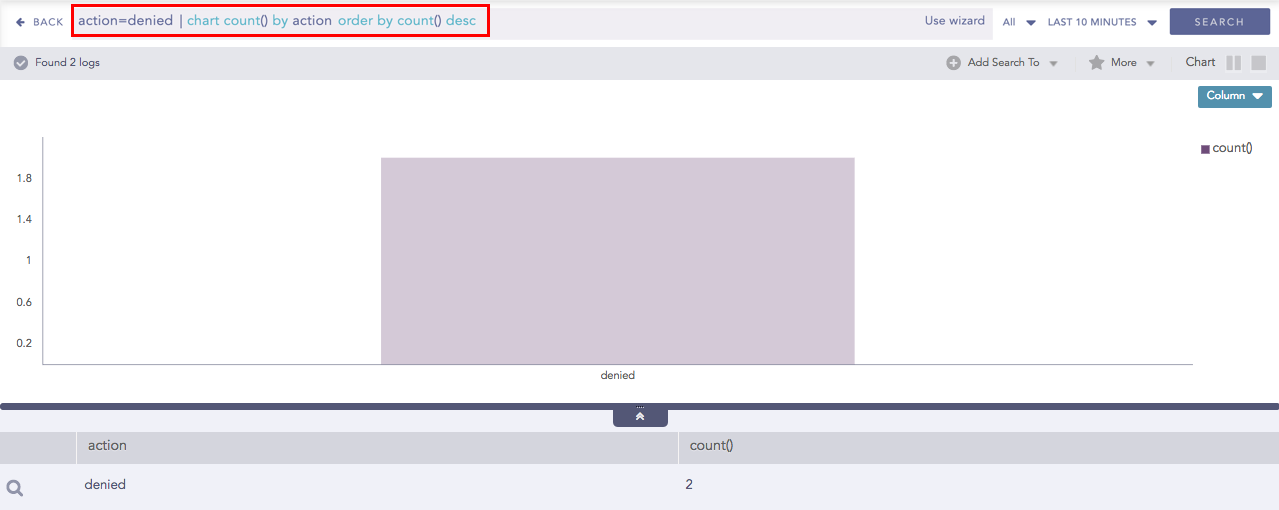
Drilldown by result
New query:
action = denied| chart count() by action order by count() desc
For Top 10 Drilldown by, when you execute the drill-down on field-values or label, the search is executed with the given query followed by | chart count() by <field> order by count() desc limit 10.
Execute a query and click the search result visualization to dive deeper. In the context menu, click the field under the Top 10 Drilldown by section. The search result of the drill-down appears on the screen.
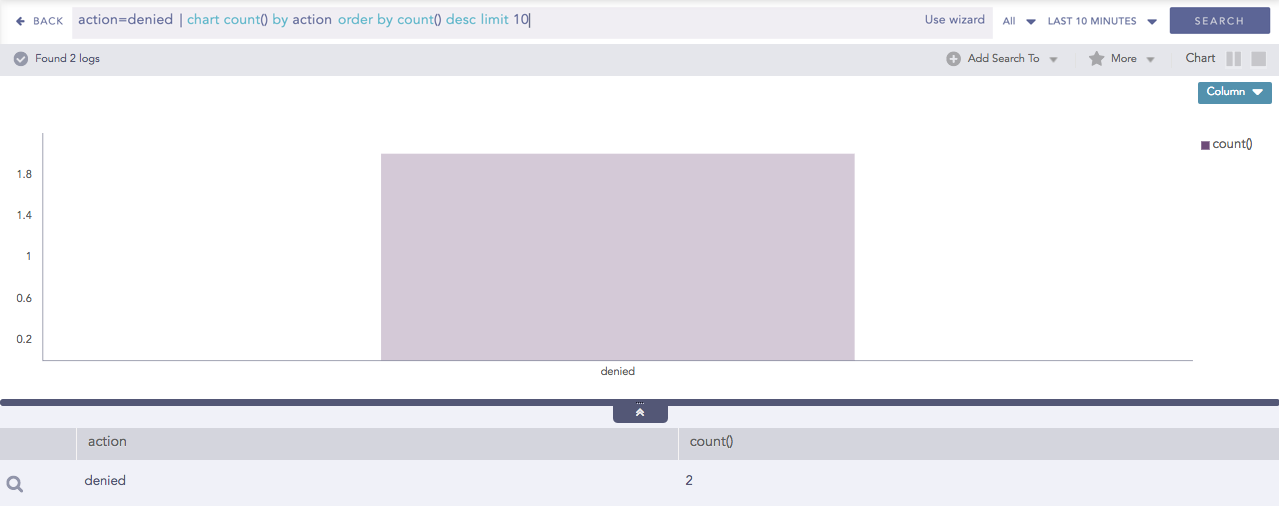
Top 10 drilldown by result
New query:
action = denied| chart count() by action order by count() desc limit 10